Trade Plan for Week of 4/11-15
Healthcare – Prescription for Fear
Follow @CordovaTrades✨ and collaborator @SLMacro on Twitter and if you find our work valuable please share.
Summary of Last Week:
Last week I outlined my plan to trade the indices with a bearish bias on a level to level basis and indicated that I would be more aggressive with positioning if the week were to open to the upside. Monday was a ripper into Tuesday so we got excellent short entries and all 3 of the major indices closed red for the week.✅
For $ES/S&P 500 Futures I had given 4592.75 as the ideal short entry while specifying that much above and I would switch my bias to bullish. The high of the week was 4588.75. I wrote that below 4478 and a retest of the bullflag breakout of 4442.50 was very likely. The low of the week was 4444.50.🎯 I live alerted on Twitter that bulls really REALLY wanted that level to hold when we got there.
For $NQ/Nasdaq futures I said that I would take a short first at 15085.75 then 15209.75 and flip my bias to bullish much above there. The high of the week was 15198. I said that if price fell below 14623.75, it would likely go to the 14358 🗝️. The low of the week was 14310.50.🎯
For $RTY/small cap futures I said the top of the weekly bearflag channel was 2107.4. The high of the week was 2107.9. Inside of the bearflag I gave 2040 as interim support and alerted on in real time on my public Twitter when price ‘booped’ off of that level before eventually going lower to 1978.8 for the week.🎯
I noted that GDX (gold miners) and XOP (oil equities) ETFs both closed near the highs and both right on my resistance levels from the week before. I said that while most technicians would say that equities typically lead commodities, I wasn’t convinced the week would follow suit and indeed we got a mixed bag last week with Oil closing lower and Gold closing higher. This was consistent with my statement:
“While gold and oil have been traveling together so to speak, the relationship is indefinite so it’s best not to rely wholly on the recent correlation.”
We published a (very timely!) uranium market overview available to all midweek and my included CCJ chart closed the week exactly on the 30.31 pivot given on Wednesday.🎯 Thank you so much for all of the great feedback and compliments on our work!
This newsletter contains a high level view of our Healthcare macro outlook, our expectations for the rest of this year and what we are watching. We have also added BTC and ETH analysis to be included weekly.
Here’s how the week closed out:
Plan for the week ahead (4/11 - 4/15/22)
If you would like to watch the accompanying video
While last week I wanted (and got) a bullish start to the week for indices to position for short entries, I believe it’s likely that the week opens with a bearish thrust, so I will outline where I will take profits and then either add back/or possibly switch bias on a level to level basis on each of the charts.
Note:
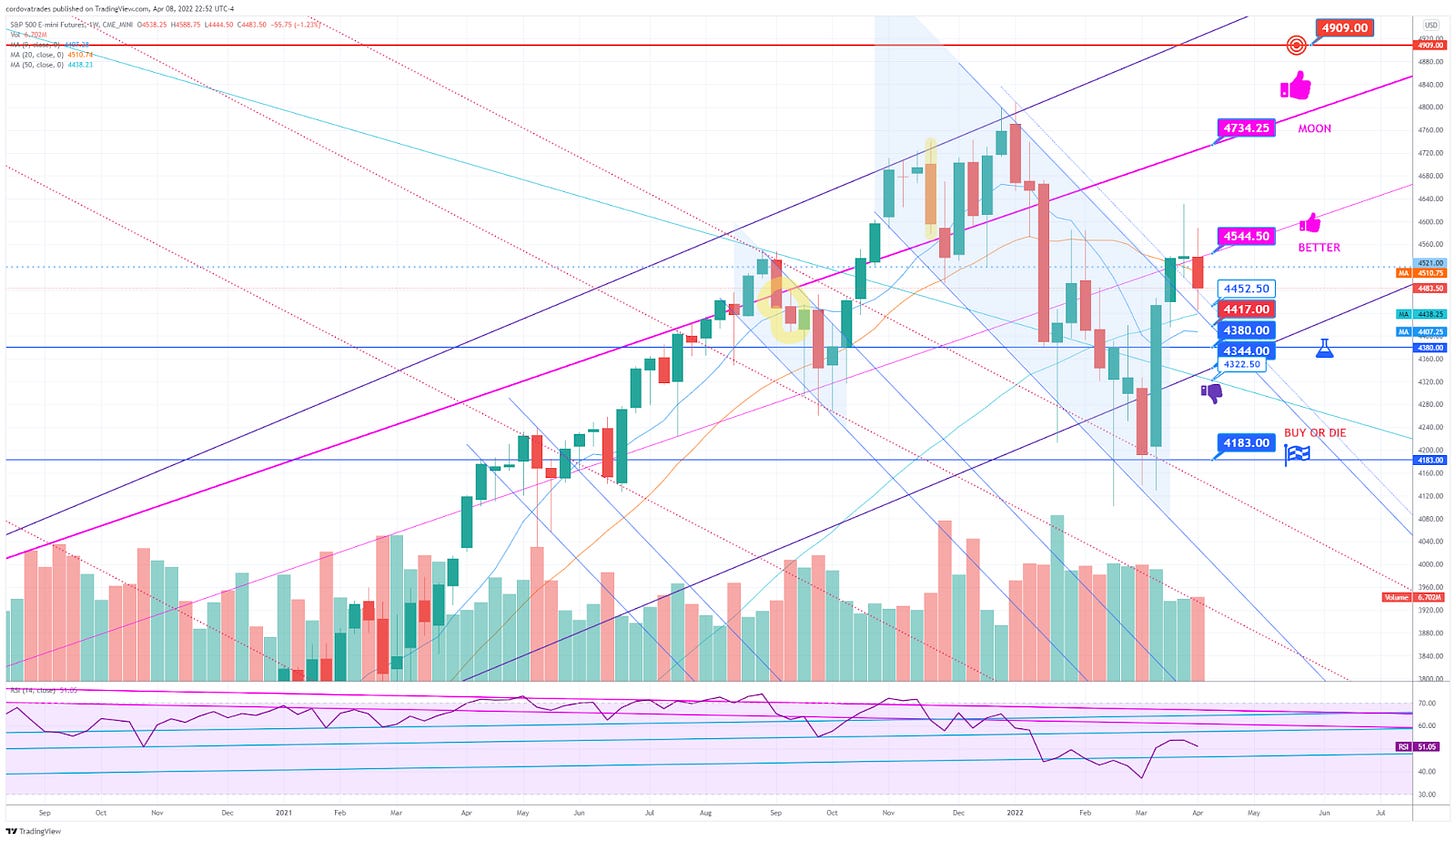
$ES is the strongest of the 3 indices and price action remains above its weekly bullflag breakout with an almost perfect technical backtest last Wednesday. Therefore the VIX has been tamped down thus far.
$NQ closed back inside of the weekly bullflag and marginally below the 🗝️pivot.
$RTY price action is still firmly embedded in its weekly bearflag and below the 9, 20 and 50 Moving Averages.
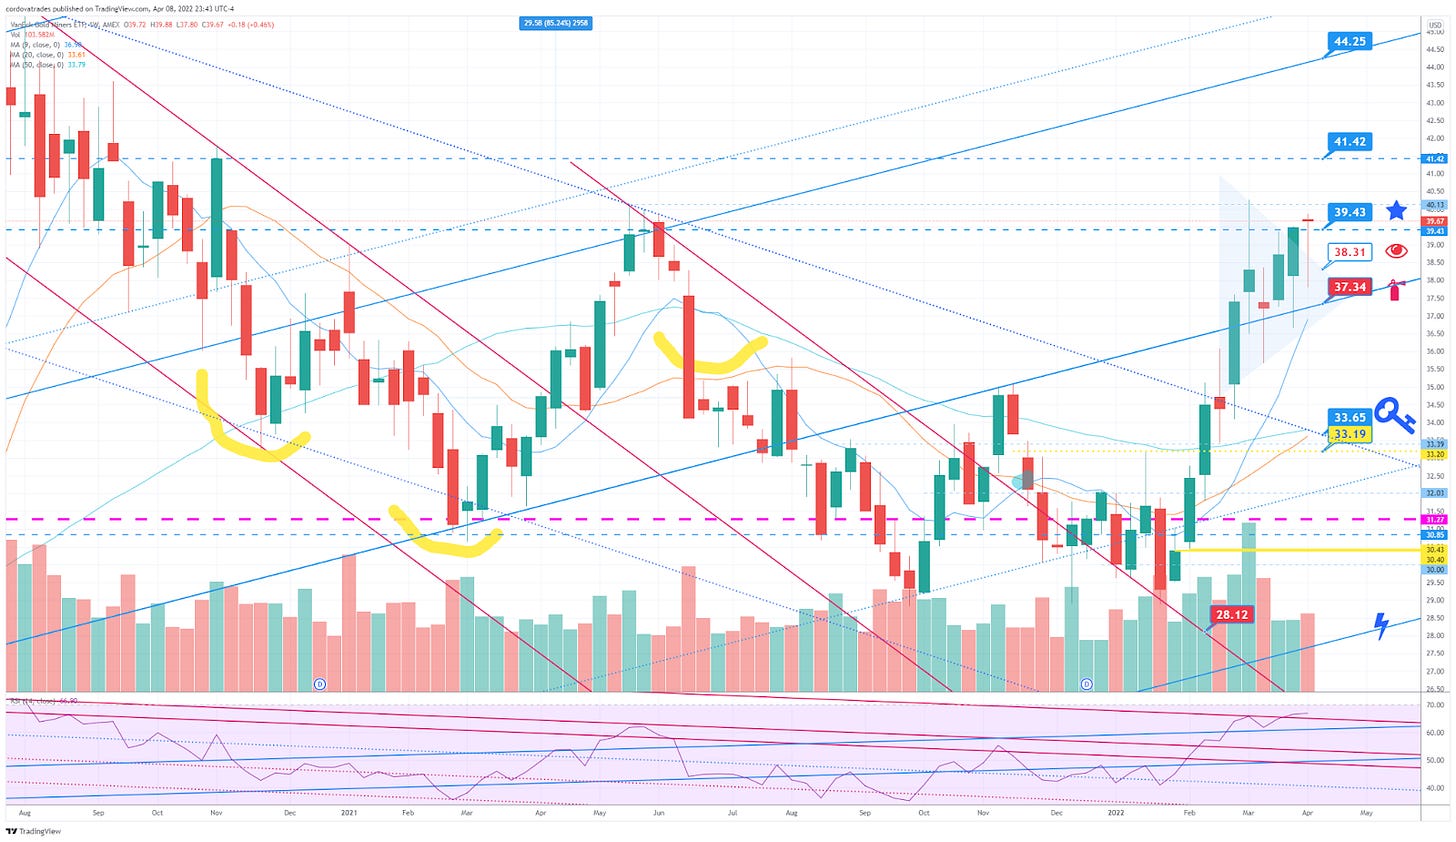
The price action for both the GDX gold miners and XOP oil equities look remarkably similar to each other once again, despite the differences in the underlying commodity price action over the last week. Both created weekly dragonfly dojis above previous resistances. Often if this type of candle forms after a price uptrend, it may indicate that a price decline will follow. Because of the recent volatility for both commodity and equity pricing I will keep in mind conventional ideology, but also outline my anticipated scenarios for alternate paths in the individual charts.
Despite strong upward momentum in Natural Gas price action, I believe a pullback to test previous resistance is possible this week. Because of the chaotic nature of $NG price movement, many do not trade this commodity.
$ES/$SPX/$SPY/S&P 500
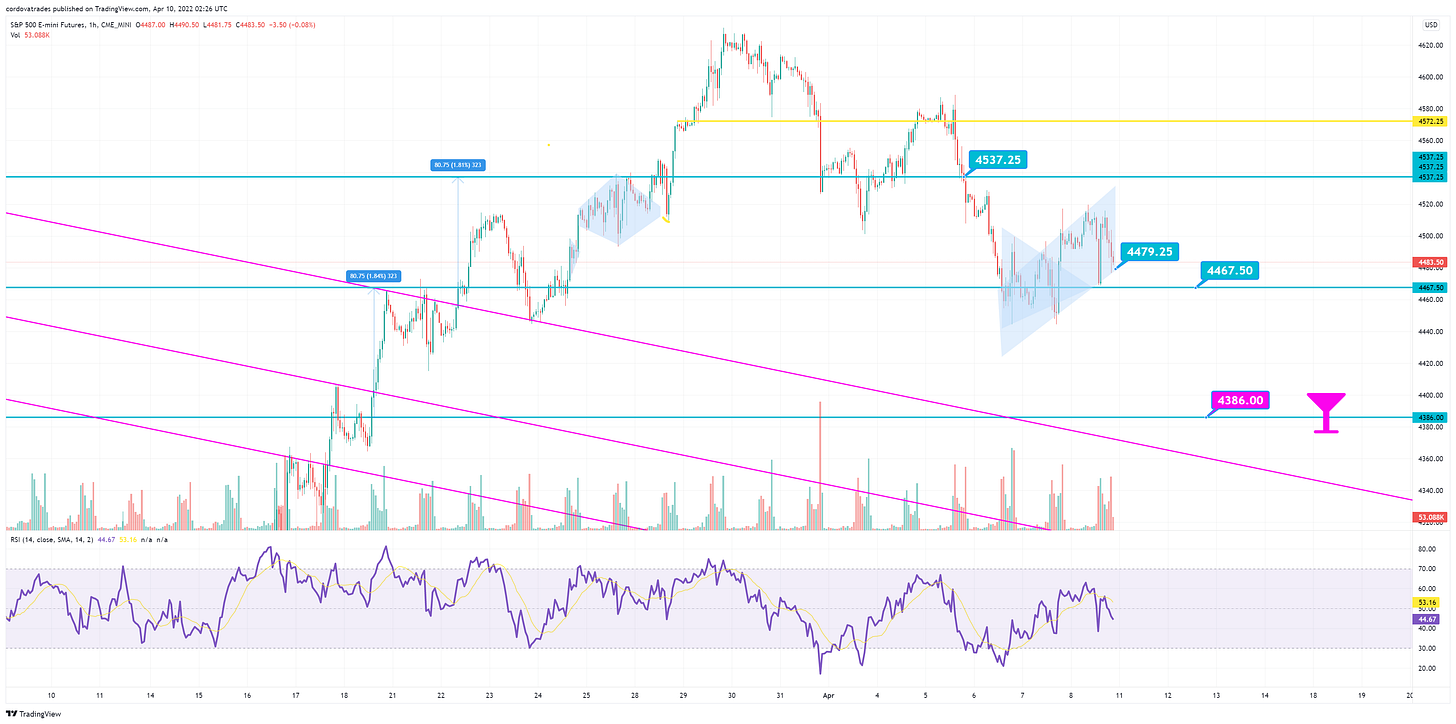
$ES is the strongest of the 3 indices and price action remains above its weekly bullflag breakout with a technical backtest last week. The hourly time frame, however, shows $ES to be in a bearflag. Should we get my anticipated initial downward thrust for the week, redemption price support for the week is 4452.50, but the measured move for the hourly bearflag and the ‘gravity’ below the 4417.00 bullflag channel will give a price target of 4380-4386. My plan is to take my remaining short profit there and watch smaller time frames for clues. Back above 4417 from there and potentially I will shift my bias to bullish and will update on Twitter. If price is unable to surface from 4380, I will look to 4344 and 4322.50 supports. Much below 4322.50 and price could fall further to 4183 very rapidly. If price action is able to recapture 4544.50, that would be very bullish.
Hourly $ES chart for reference:
$NQ/US Tech 100/Nasdaq
$NQ closed back inside of the weekly bullflag and marginally below the 14361🗝️pivot. The 14496.25 bullflag channel is the next resistance above and would be a logical place to attempt a short should we see it early in the week. Much above and I will flip my bias to bullish with a target of 14978.25. The next technical support below the🗝️ inside of the flag is the weekly 9MA which I estimate to be about 14209 if price initially begins the week on a downward path. Below the 9MA there is significant support in the 13837.25-13899.25 area. I believe that would be a high probability bounce area at least for the short term. Much below that and 13107 is possible but improbable and would likely not hold longer term.
$RTY/$IWM/Russell 2000 Small Caps
$RTY price action is still firmly embedded in its weekly bearflag channel and below the 9, 20 and 50 Moving Averages. I have 2 levels of support below last week's close at 1948.2, the bottom bearflag channel boundary, and 1906.5, the last redemption support. Below there a rapid fall to 1715 would be quite possible. Above current price there are resistances at the 9MA (approximately 2030) and the 20MA (2085ish) before there is strong resistance at 2112.2 where 2 of my trend lines intersect.
$GDX/Gold Miners ETF
GDX formed a dragonfly doji last week, which is not my favorite candle in uptrends. In the short term, above the 39.43⭐️ line is technically bullish with 41.42 being the next resistance of any significance. Back below 38.31👁️, there is a high probability of tagging the 37.34🧯, which would also coincide with the 9MA.
$GC/Gold futures/$GLD
Gold still looks to be in healthy consolidation on the weekly timeframe with a tightening range. This week I was able to draw a triangle structure/bull pennant to give more granularity to the price action. On the 4 hour chart gold ended last Friday looking quite bullish. An upwards thrust to 1973(4hr pivot) is possible if price opens and then holds above 1944.4 on Sunday evening. 1926 remains the pivot to watch in the event of a pullback and now also coincides with the weekly 9MA. There are supports below at 1916.3 and 1904.9. In the event of a sudden and extreme downdraft, the area I will scale in to buy is 1850 down to 1841.7.
$SI/Silver/$SLV
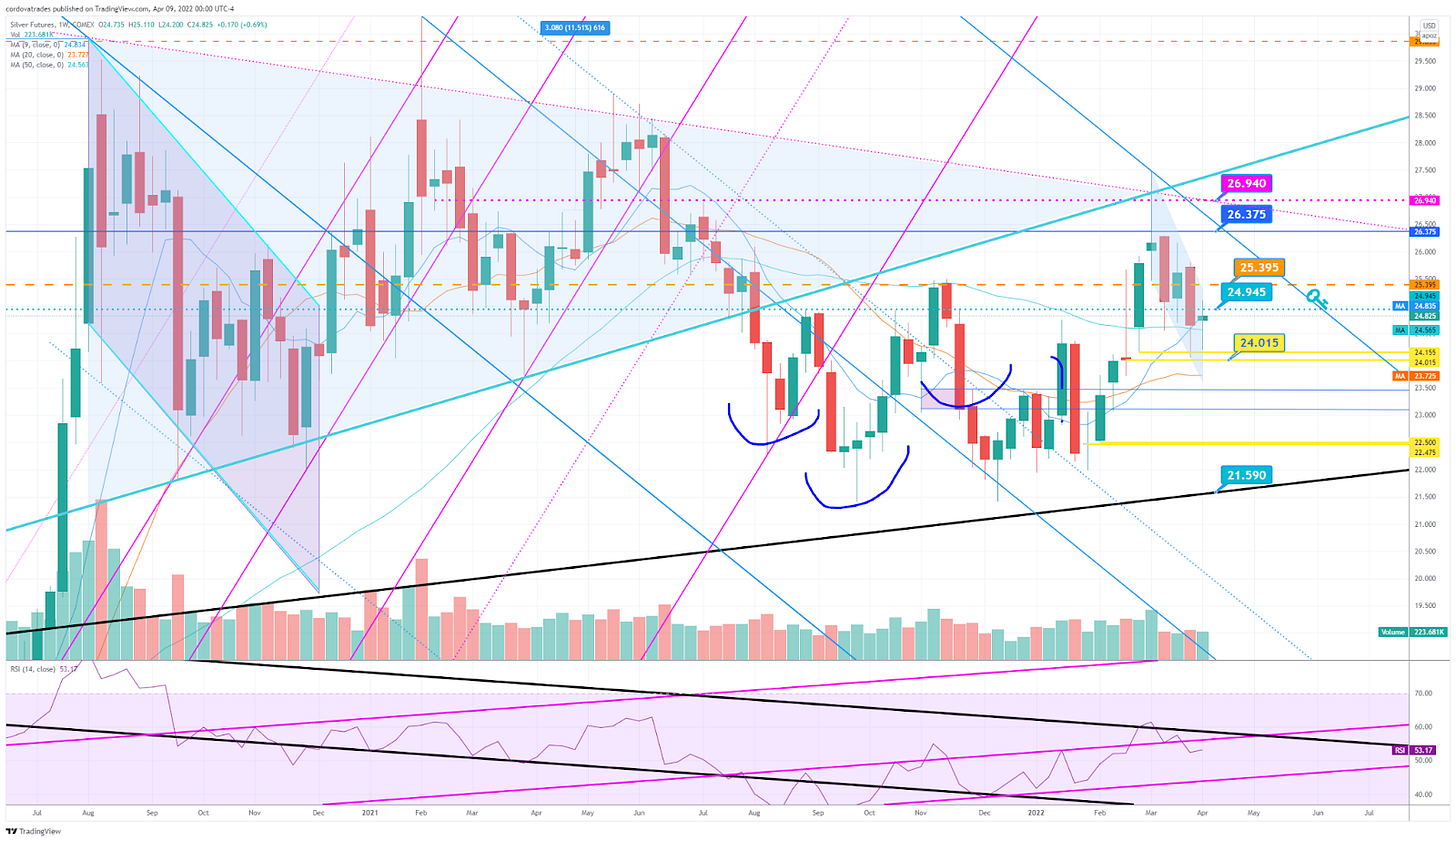
Silver also remained in a tight range over the past week and closed just marginally below the 🗝️pivot of 24.945. Above 25.395 is a breakout and will target 26.375. There is support at 24.015 and the 20MA ~23.70. There remains a tiny unfilled gap offering support at 22.475-500 in the unlikely event of a sudden extreme downdraft.
$CL/Crude Oil/$XOP Equities ETF
XOP/oil equities have shown extreme relative strength to crude oil for 2 weeks in a row. Because of this divergence I believe both should be viewed separately and independently on a level to level basis. It’s possible that this divergence could exacerbate or even that each could change directionality and diverge in the opposite directions. Even though Oil closed last week just above the purple🔨 line, if it opens flat it will be below that line with an immediate resistance of 99.03 and support in the 91.59-93.53 area before 89.23. It is bullish for this week above 101.29 which is both the bottom of the pennant it fell from last week and the 9MA. The next resistance above is 107.34 before the 112.92-113.90 open gap. This week XOP is bullish above 138.47 and a trail stop may be ideal to lock profit. Below and the price target is an unfilled gap that intersects with the 9MA at 125.19-126.03 before a breakout backtest of 122.03.
$NG/Natural Gas/$UNG
Natural Gas defied resistance last week and broke out of an upwards channel with significant momentum which is why I am happy I said that I wouldn’t short it in the previous newsletter. The next price target to the upside is now 7.191. This past Thursday I did close my remaining long to lock in outstanding profits. A backtest of 5.924 would be the top of the weekly channel, but an unfilled daily gap of 5.708-5.766 just below the daily 9MA would shake out a lot of late bulls.
$BTC and $ETH
About 6 weeks ago on YouTube I alerted viewers to the possibility of an ascending triangle forming on the BTC daily chart. On the breakout price failed to get above my bull/bear 🗝️level of 48480.8 and has now fallen back inside of the structure. While it can breach the bottom of the triangle and still recover, I am cautious below 42051.6(Sunday/Monday value). 40,000 or so is about all the wiggle room I will give it if that happens. The next support below is 35676.7. Back above 44300.6 and then I’ll look to a break back above the 🗝️ again to become enthusiastically bullish.
ETH is now midrange above the mini 🗝️pivot of 2960.78 but below the 3969 bigger picture 🗝️. For now those are the 2 main levels I am watching until I see another structure forming.
Big Picture Macro Healthcare – Prescription for Fear
In times of worry and fear, investors often flock to defensive stocks that provide stability with consistent earnings and a steady dividend. Healthcare historically outperforms during these times. The sector includes hospitals / healthcare facilities, insurance companies, drug and medical instrument manufacturers, and biotechnology companies. Regardless of inflation, or an economic downturn, people still need to seek medical care and fill prescriptions.
As fears of inflation, rising rates and an economic slowdown continue to increase in 2022, the stock market has felt the pressure of uncertainty. Year to date the S&P is down -5.21%. Conversely, large healthcare stock socks are thriving. The S&P Health Care Index is up 1.26% in this time and many large healthcare companies are outperforming the market significantly. It has been a tale of two cities, with small and mid-sized biotech companies under pressure for the past year while large established companies prosper.
I contend that large cap defensive healthcare stocks will continue to outperform the general market in 2022 as economic and recession fears worsen. I also believe that biotechnology stocks will begin to reverse trend in 2022 into 2023 and outperform the general market going forward. The thesis for large cap healthcare stocks is straightforward and doesn’t require much explanation. They are thought to be recession proof for a reason. People may sacrifice a Netflix or their gym subscription, but in good times or bad, they will continue to buy medications. For device makers, many rely on elective procedures that were shut down or slowed due to the pandemic, and the expectation is for these procedures to see an uptick in 2022. For the rest of the article, I will dive more into the biotechnology sector that has been beat down over the past year.
Bio-Beat Down
Biotechnology stocks saw a frenzy of activity during the Covid-19 epidemic. With potential vaccine breakthroughs, speculators piled into biotechs with XBI peaking in Feb 2021. Since then, XBI is down around 48%. In the past year it was the worst performer of the 11 S&P 500 sectors. I believe that this trend is due to reverse.
Why the Sell Off
· Overreaction to vaccine success by investors
· Record level of VC investment and IPO offerings past 2 years
· Regulatory pressures from the FTC on M&A
· Uncertainty around drug pricing reform
· Delays in drug studies and approvals due to Covid-19
During the pandemic, there was an IPO frenzy with record amounts of money raised. Historically only about 18% of preclinical companies went public. During this time preclinical biotechs made up about 30% of IPOs, many years away from a possible viable drug candidate. Since then companies that went public in 2021 have pulled back about 35% from their IPO price. As many mid and small-cap biotechs have sold off since their peaks in Feb 2021, this has allowed for valuations to come down dramatically. Valuations for the sector now trade below the valuation for the S&P, making the sector much more attractive. The sector is trading at 12.9 times forward earnings estimates.
Mergers and Acquisitions
The past year saw a drastic decrease of M&A in biotech and reached decade lows in 2021. I believe this trend will reverse in 2022 and 2023. During the pandemic, new drug companies had flush access to money from record VC influxes and did not require acquisitions for cash flow to continue drug trials. On top of this, valuations were sky high, making acquisitions unattractive. Instead, these large-cap companies have been building their war chests for the past 2 years and are sitting on record levels of cash. At the same time, large-cap biotechs are also facing a significant number of patent expirations. They need to replenish their patent stores, and one of the easiest ways to do this is to acquire late stage small and medium cap biotechnology companies. PwC projects the sector could see $350-400 billion worth of M&A deals in 2022. I believe that an uptick in acquisitions will help the biotech sector regain its footing.
Tailwinds
· Significantly improved valuations (Back to 2018 levels)
· Permanent FDA commissioner installed
· Drug studies halted or slowed from Covid resuming
· Uncertainty around drug reform expected to improve with expectations for lawmakers to push for resolution before midterm elections
· Large drug companies flush with record levels of cash
· Increased expectations of M&A
· Non-Cyclical sector historically less impacted during economic downturns
Summary
· Healthcare, specifically large caps, serve as defensive stocks in times of volatility and fear. In 2022 they are outperforming the general market and I believe they will continue to outperform.
· Biotechs have had a significant pullback and at current valuations are attractive compared to the general market .
· The expectation is for Biotech M&A to increase in 2022, driving a rebound in the sector
According to Geoffrey Porges, of SVB Leerink (commercial bank focused on healthcare), in the last three recessions, biotech indices outperformed the S&P 500 by 18% and pharmaceutical indices outperformed the S&P 500 by 10%. I believe in the current environment with high inflation and slowing growth, an allocation to both large cap healthcare companies and biotech is prudent. I will be adding to large caps as well as XBI on pullbacks and will continue to add to individual speculative small biotechs on weakness.
XBI Weekly Chart
It’s possible that XBI may have begun the bottoming process. On the weekly chart I am watching for the 🗝️line pivot of 85.72 to be supportive should we get a pullback below the 9MA.
Scheduled Market Events This Week
Watchlist or Held
Non-option/ Shares only account since inception of The Moneymaker on 3/27 +8.14% SPX -1.16%
Options account since inception of The Moneymaker 3.8% (86% of funds in cash)
Disclaimer : This newsletter or information within does not in any way represent investment advice. The reader bears responsibility for any investment decisions, and should seek the advice of a qualified professional before making any investments. Owners/authors of this newsletter are not certified as registered financial professionals or investment advisers. The newsletter is for general informational purposes and entertainment and none of the information contained in the newsletter constitutes a recommendation of any particular security or investment strategy. The Owners/authors of this newsletter accept no liability for any direct or indirect loss arising from use of information within the newsletter. Subscribing to or reading the newsletter, or any future publications, constitutes agreement to these terms and reader agrees to release and owners/authors harmless from any losses or damages as a result of reading this newsletter or on any information contained herein, or in any communications including but not limited to tweets, emails, or other internet posts.


Thanks!
Also, nice call on silver. Seems to have pulled through.