Trade Plan for 9/30-10/4
Will October be scary or can we expect the Bull Fairy?
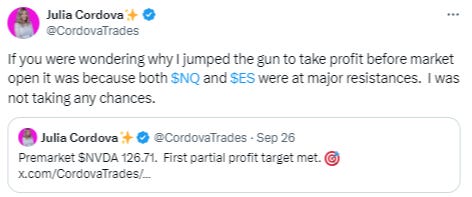
Last week both $ES/SPX futures and $NQ/Nasdaq futures had ‘double resistance’ levels on my weekly charts. That means that 2 of my trendlines were very close together in both charts. Price action for both indices reached double resistance at the same time as each other AND the waypoint resistance for $NVDA I had given from the bullflag breakout.
My note to members that morning in premarket:
I took some $NVDA profit and shorted both of the indices there, remaining short for the duration of the week adding to my positions at local resistances and covering some at support.
I felt most optimistic for precious metals and specifically a bull move for silver early in the week. I ended up taking profit at my 32.785 measured move resistance because $SI/silver futures was also there when $ES and $NQ were at double resistances.
My guidance for oil on the chart:
Summary of Market Action Last Week:
$ES/SPX futures and $NQ/Nasdaq futures chopped upwards in a relatively small range over the course of the week. Despite $RTY/small caps futures being the strongest index last week, this week it closed with a slight decline.
$GDX/gold miners advanced in the first part of the week, but took a tumble on Friday. It closed nominally red. $GC/gold futures and $SI/Silver futures progressed higher on the week.
$XOP/oil equities lost ground on the week, despite being the relative strength winner last week. $CL/Crude Oil futures also settled red.
Here’s how last week closed out:
For the week ahead (09/30 - 10/04/24)


