Trade Plan for 1/8-1/12
1 week red, but is it dead?... and another look at $TSLA
Last week I described the price action as having put in what I thought to be a ‘soft top’ but I remained only cautiously bearish at the beginning of the week because the possibility of a blow off top still loomed.
I continued to watch $TSLA for clues. Last week I shared my weekly chart with you here. $TSLA hit a high of 251.25 vs my resistance of 250.82. That is less than 0.2% over. 🎯 For this week:
$TSLA is at critical daily support. Any close below 236.17 likely flushes to 208.69. A weekly breakout is not established without a close above 248.73. Confirmation is a daily close above the descending pink 🍸line on the daily (unmarked here as it changes daily).
I remained cautiously optimistic for precious metals, outlining my technical concerns and giving ‘must hold’ levels.
$CL/crude oil remains in a chop zone.
Summary of Market Action Last Week:
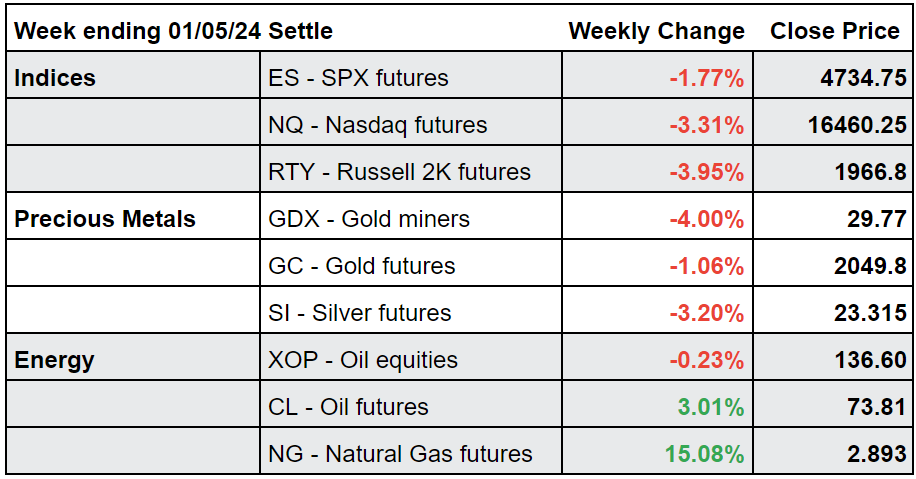
After another holiday Monday, the indices dropped each day until Friday, when both $ES/SPX futures and $NQ/Nasdaq futures managed a weak bounce to close faintly green for the day. $RTY/small caps futures continued downwards on Friday to close the week red once again and led losses.
Precious metals weakness continued, but $GC/gold futures closed only slightly red after a volatile Friday. Gold held relative strength to $SI/Silver futures for the 3rd week in a row. $GDX/gold miners lost ground against the indices gapping down on Wednesday and then holding essentially flat closes through Friday.
$CL/Crude Oil futures closed the week higher but still printed a lower high and lower low week over week. $XOP/oil equities demonstrated relative strength to the indices with a nominally flat close on Friday.
Here’s how last week closed out:
For the week ahead (01/08-01/12/24)


