Trade Plan for 11/11-11/15
Will CPI fuel or cool this incredible rally?
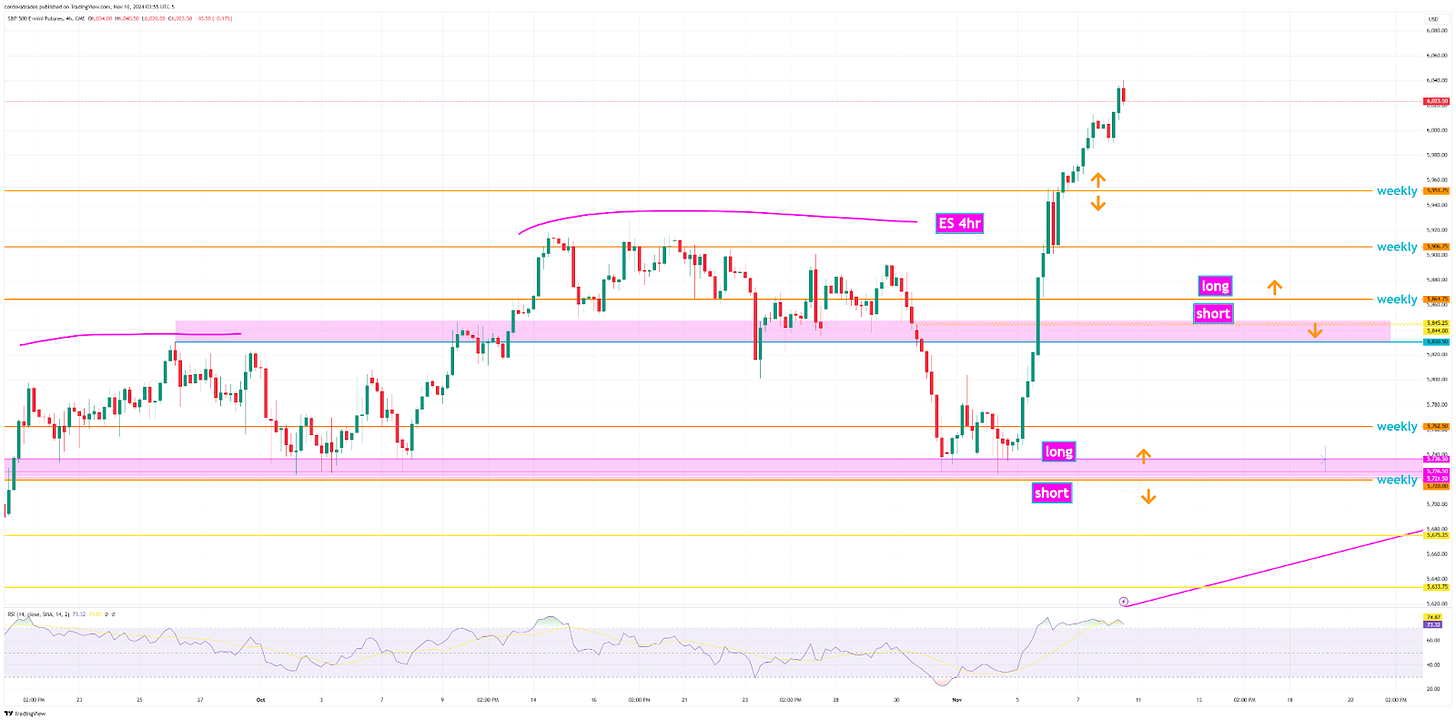
Last week I did not have a strong directional bias for the indices, but instead drew a game plan based on what looked like a large possible head and shoulders structure forming on the 4hr $ES/SPX futures chart. Here was my overall long/short plan I published last Sunday:
The plan got me to take the long in the beginning of the week at the ‘neckline area’ 💰and then on Election eve price action reached what I anticipated to be ‘shoulder area’ where I tried shorts but that evening it broke above the ‘long’ weekly level and backtested. ✅
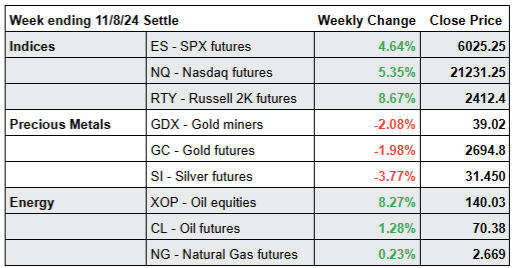
Here is the performance of my weekly levels vs price action for last week🏆:
I was most confident in precious metals heading lower for the week. ✅ I was levels based bias for oil and suggested a large inv h&s could be forming on the $XOP/oil equities weekly and that price could be at the bottom of the second shoulder:
Summary of Market Action Last Week:
The indices had trend up energy all week. $RTY/small caps futures, the clear outperformer, rocketed higher reaching just a hair under its all time highs.
$GDX/gold miners and precious metals underperformed for the third week in a row. $CL/Crude Oil futures started the week with a gap up, but then oscillated wildly. It closed the week higher than last, but just a hair above where it opened on Sunday. $XOP/oil equities dramatically outperformed the commodity and showed relative strength to indices.
Here’s how last week closed out:
For the week ahead (11/4 - 11/8/24)


